Monthly Archives: September 2010

iPod apps for Biology learners

ipod_panorama2

I’m enjoying loading up my new iPhone with lots of science and maths apps, including some that are especially relevant to VCE Biology students.  Mitosis is a free app that has images, videos, a glossary, a ‘tutor’ and other resources from wikipedia, Botanical Society of America, NOVA online and Florida State University. It has images and written and audio descriptions of each of the phases as well as a 10 question multiple choice test. Hudson Alpha Institute for Biotechnology has produced another free app called iCell, which has annotated 3D images of animal, plant and bacterial cells. You can select organelles and read about their structure and function. So, if you already have an iPod touch or an iPhone, these are the two I would recommend for VCE Biology. If you have any other suggestions, please leave a comment below.

Another free app, that might not be quite as useful is Phyto, which is a phytoplankton identification App from Shawn E. Gano. It has images, descriptions, flashcards and pronounciation of 28 different species of phytoplankton. I’ll be looking forward to a similar app. for Australian freshwater macroinvertebrates! I also downloaded “Ecosystems” which I thought would be interesting, but it is specific to an exhibition at the California Science Centre and only useful if you were actually doing a tour of the exhibit.

Population Ecology

predator_prey_graph

Image Source

Population Ecology is the study of the numbers and distribution of groups of organisms. The Biology Q and A site has some good revision for exams at Population Ecology in question and answer format. Breathing Earth is the site I showed you in class with informative, animated graphics that show a comparison of births, deaths and CO2 emissions across the globe. It clearly shows how the rate of births and deaths in China, India and Africa differs to those in Australia and North and South America.

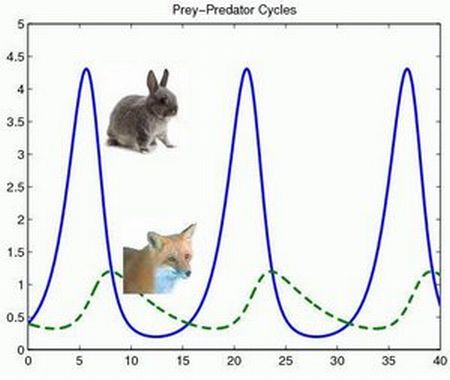
This Predator Prey simulation is based on a cardboard grid and game pieces representing rabbits and lynx. It demonstrates how the population of predator and prey impact on each other. At the Gould League site there is another activity that clearly shows how predator/prey populations interact with each other, this time with kangaroos and dingoes in an Australian ecosystem. Draw a graph of the data, showing the predator and prey in different colours. Then answer the following questions:

  1. What patterns can be seen in the graph? Suggest reasons for any patterns.
  2. Is there any relationship between the kangaroo and the dingo numbers? If so, account for this.
  3. The park management have decided to stop a rabbit prevention program because it is too expensive. What effect could this have on the dingo population and why?
  4. Identify the reasons for the absence of large migratory populations in Australia.

Biogeochemical Cycles

Nitrogen_Cycle

Image Source

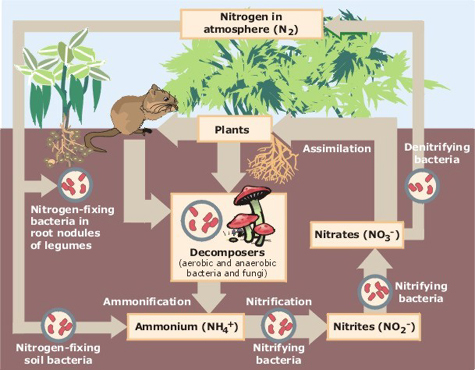
Chapter 14 is about the biogeochemical cycles that allow inorganic chemicals and carbon to be cycled through living organisms and non-living parts of ecosystems. There are four main cycles we need to consider and each group of students will prepare a presentation and poster about one of these systems:

Water – Chris and Catherine

Carbon – Charlotte and Tara

Nitrogen – Emily, Chloe and Stephanie

Phosphoros – James and Melissa